Marketing is more focused on metrics than ever before, and at the same time produces lots of data and numbers. But those who want to use the numbers to monitor and measure their activities quickly find it difficult to keep track. The solution: KPI dashboards help, because they bundle and visualize key figures. But how much does something like this cost? We’ve taken a closer look at this aspect of our KPI Dashboards market overview for you in this article. You can download the detailed overview of the price models.
The frequency of online marketing has risen sharply. This applies to both the number of measures and the number of channels on which companies are present. At the same time, internal company expectations of marketing departments have risen, especially when it comes to measurability and ROI. Budget allocation according to the watering can principle has never been good, today it is fatal. Because there have never been so many bottomless barrels out there into which unlimited budget can be sunk. If you don’t pay close attention. Good monitoring of measures is now mandatory and – let’s be optimistic – has long been part of everyday life for marketing managers. But with the number of channels, campaigns and measures, the complexity of this monitoring increases and it becomes more and more difficult to get an overview. This is where KPI dashboards can help. Because instead of clicking through the reports of the various channels or consolidating reports in Excel constructs yourself. In our market overview, we have compared 11 providers of such dashboards for you. The individual solutions differ in the scope of services, and connectivity, as well as many other points. Also in the pricing approach. But what does it actually cost? And what is the pricing logic behind it?
Dashboard for Purchasing
Today, professional purchasing is a key success factor for almost every company in various industries when raw materials, goods, products or services are purchased externally. Classic purchasing” is no longer limited to manufacturing companies that buy the raw materials and goods they need, but also plays a decisive role in cost optimization, for example in large media companies that use many external services. Modern, interactive KPI dashboard tools such as datapine help you to keep an eye on all relevant key figures and to manage your purchasing effectively. To illustrate your options, we have created 3 purchasing dashboard examples for you.
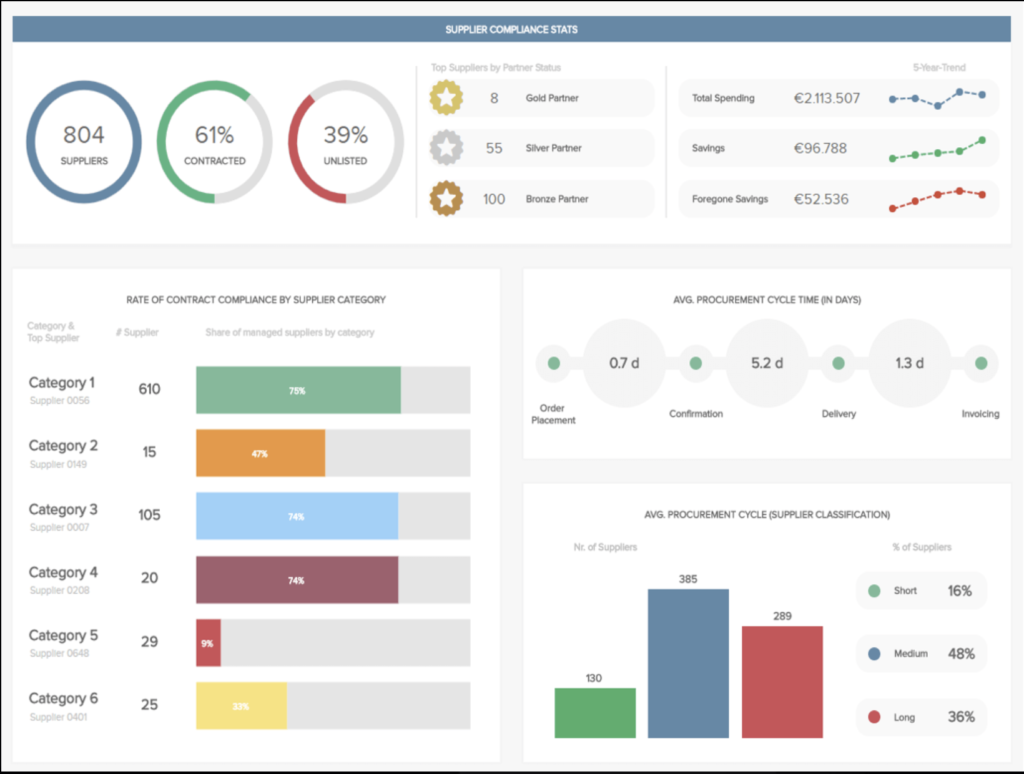
Our first example is the “KPI Dashboard for Purchasing”. It shows, among other things, the compliance rate, the number of suppliers and the entire purchasing cycle in a visually appealing way. In terms of supplier compliance requirements, we can see that of the 804 suppliers, 61% have accepted them. These requirements can vary greatly from company to company and include, for example, agreements on processing and delivery times or special discounts. Subsequently, the suppliers were divided into gold, silver and bronze partners in even more detail using an ABC analysis. In addition, it makes sense to take an even closer look at the compliance rates for the most important purchasing categories. There are often large differences here, as shown in our example with compliance rates of 9 – 75%. Such an overview helps you to quickly identify areas with low compliance rates and then take a closer look.
On the right side of the dashboard, you will find an overview of the entire purchasing cycle from order placement to delivery and payment. Again, suppliers have then been divided into 3 categories to quickly identify the partners that can turn your orders around the fastest.
Ongoing costs for KPI dashboards
Before any costs are incurred, there is good news: in most cases, you can test the software for free. This option is offered by 80% of the providers in the market overview. However, the running costs for the KPI dashboards are quite different. The range here is from 25 euros per month to 850 euros per month. The average value here is 340 euros. However, these figures only reflect the absolute minimum costs. Depending on the provider, the costs depend on various factors or increase accordingly. These factors are for example:
- Number of users
- Number of data updates per month
- Number of dashboards
- Number of business units
- Is the solution desired as a white label?
- Number of data sources
- Service level